New Thoughts About the 2014 Run
The spring salmon season on the Miramichi is now more or less over. It has lasted a bit longer than normal, and from my conversations with a some of the outfitters and guides who fished it nearly every day, I’d say that it was a better than average fishery for salmon and a bit below normal for grilse. It was, though, quite satisfactory and anything but a disaster. There were some good and consistent catches made and over a wide area of the river. So what does this say about the record low estimates of last year’s run which was put at about 12,000, or about 60% of needed to meet spawning requirements?
I have done a little work with the Cumulative Counts for last season that are quite interesting. First, these counts are the numbers of fish taken daily from a net trap located in the upper SW Miramichi estuary in Millerton. The fish are removed from the net daily, counted, and tagged by the Department of Fisheries and Oceans, and then released back into the system. Fish are later recaptured up in the rivers and from the percentage of fish recaptured that are tagged an estimate of the entire run is calculated. It is admittedly a rough estimate, and the DFO publically state’s that it tries to be conservative in its estimate and considers the numbers to be minimum estimates of the run. 
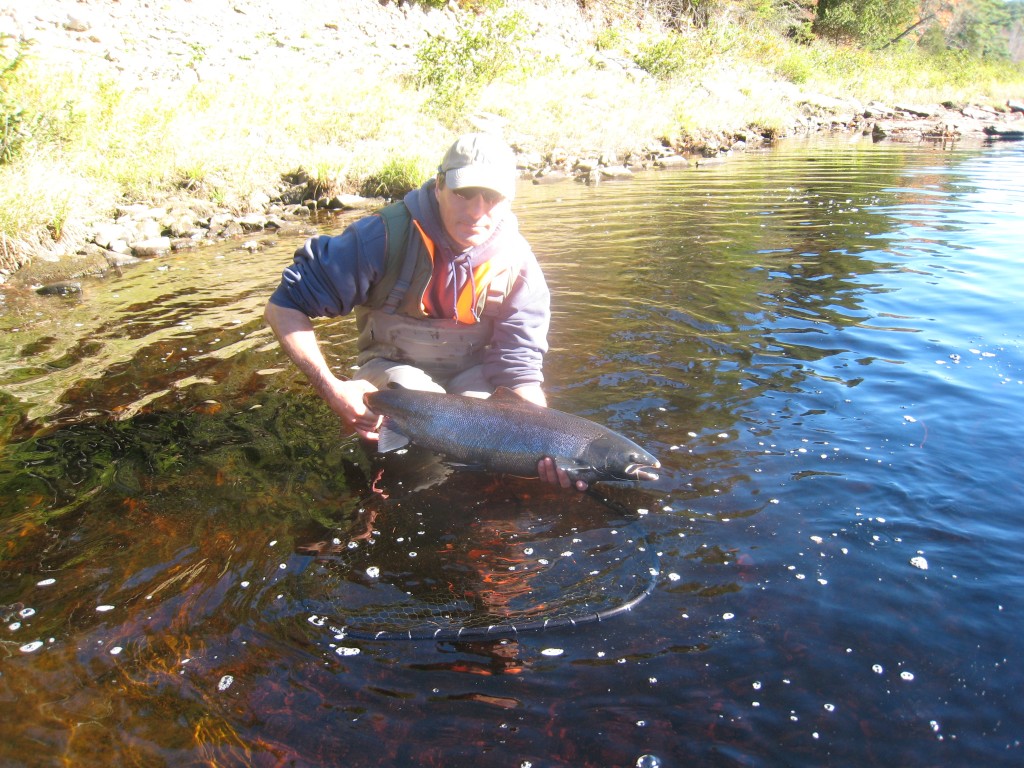
Adverse conditions are not unusual during any season, and occasionally the net must be removed due to high water. In 2014 the floods from Hurricane Arthur tore the net away and it was out for the first two full weeks of July before it could be repaired and reinstalled. This is also the most prime time on the river. I was there, fishing, and reported on it in an earlier blog and in this picture post on the Salmon Forum. Without a question it was the thickest run of fish that occurred during the season, especially for grilse. As is normal, the second half of the month saw much smaller numbers of fish entering than the first.
On June 30 the count for the season to date was 31 salmon and 49 grilse. On the fifteenth of July it was still 31 salmon and 51 grilse, but on July 30 it had jumped to 153 salmon and 246 grilse. This means that from July 15 to the 30th 122 salmon and 195 grilse entered the Millerton trapnet – compared to zero in the previous two weeks. Of course this doesn’t reflect what really took place in early July. I asked the DFO about it, and they said that as a policy they report the actual numbers only and make no guesstimates. This is undoubtedly the right answer for being conservative and a protector of the resource, but the resulting statistics are not an accurate representation of the number of fish that entered the river.
When the season closed on October 15 and the run was assumed to be over, the final count showed 568 salmon and 743 grilse captured in the Millerton net. This yielded an estimated run of 12,000 fish. There is no question in my mind, having fished the Miramichi all through July of 2014, that the first two weeks exceeded the second by a factor of several times. If, though, you plug in just the same numbers for the first two weeks as recorded for the last two – see paragraph above – your season totals increase to 690 salmon and 938 grilse. How do these numbers compare to past seasons?
The average salmon numbers at Millerton from 1996 to 2000 were 596, they were 964 from 2001 to 2005, and 751 from 2006 to 2010. It seems very likely to me that the number of salmon in the run for 2014 were more or less within the normal range for the river.
Grilse numbers do not look quite as good. Runs of 1,500 to well over 2,000 are historically common. This is the third poor year in a row for grilse returns, though 2014 was the best of the last three. The large salmon are more important spawners, but the grilse may be important canaries in the coal mines as to marine survival issues.

